With our guide to life insurance statistics, facts and data, you can rest assured that you’re getting accurate information relevant to the life insurance industry.
At RiskQuoter, we provide life insurance statistics, facts, and supporting information.
Life Insurance Facts and Statistics
The Life Insurance Marketing and Resource Association (LIMRA) provides research and marketing support to help insurers understand their customers, markets, distribution channels, and competitors.
According to LIMRA, the percentage of consumers who reported owning life insurance (individual, group) was:
- 2021 – 52% of consumers owned life insurance
- 2020 – 54% of consumers owned life insurance
There was no ownership breakdown by people protecting their families vs. business life insurance for SBA loans or key person coverage.
This downward trend has been taking place for years.
The highest ownership percentage was reported in 2011, when 63% of consumers reported owning life insurance.
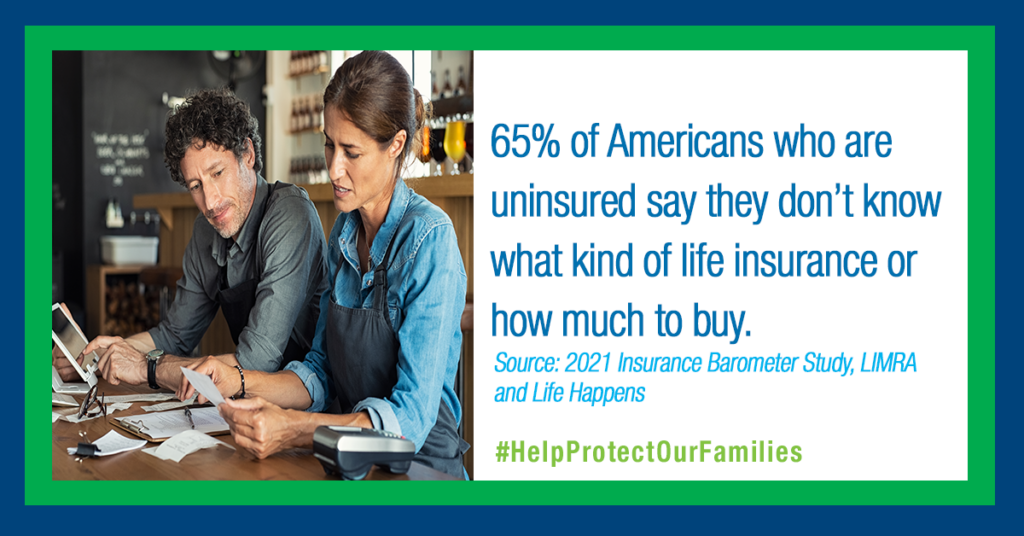
The LIMRA study further discusses the top 4 misconceptions consumers have:
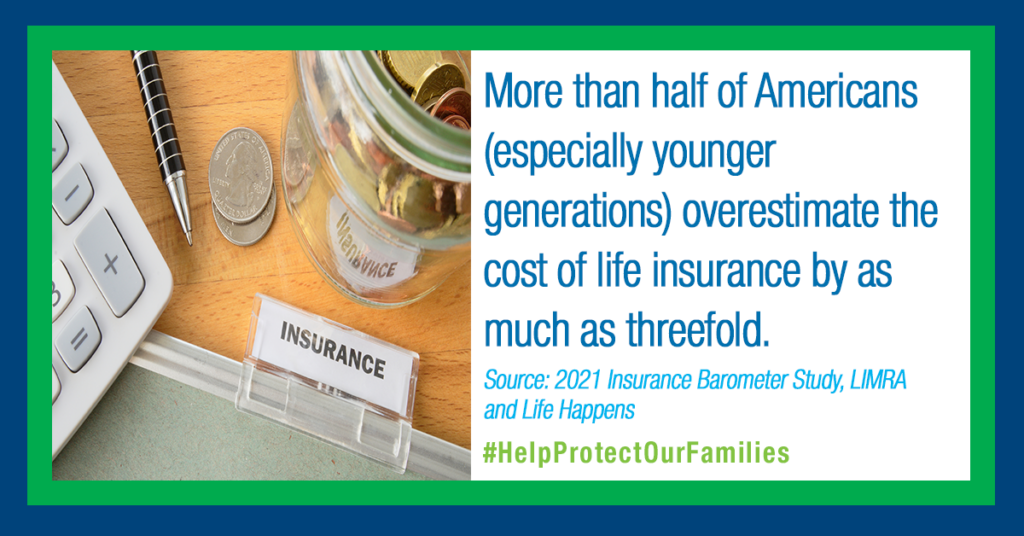
1. Life insurance is too expensive – More than half of Americans overestimate the cost.
Forty-four percent of Millenials overestimated the cost by as much as 6x! That can leave many beneficiaries underinsured.
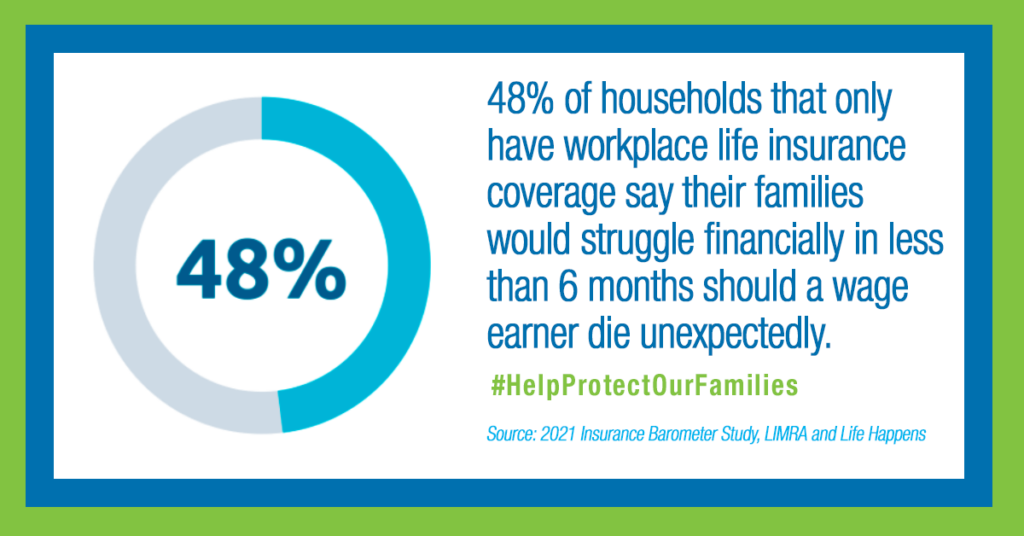
2. My workplace life insurance is enough – The median amount of life insurance offered by employers is either a flat $20,000 or one year’s salary. (for those in commission jobs, it’s usually your base salary)
On one hand, it’s nice that you don’t have to complete a paramed exam or worry about your weight for group life.
Most group coverage lacks individual policies’ benefits and features, such as riders or settlement options for beneficiaries.
3. It is too difficult to buy life insurance – COVID-19 has accelerated the adoption of no exams, e-applications, Human API, and simplified underwriting.

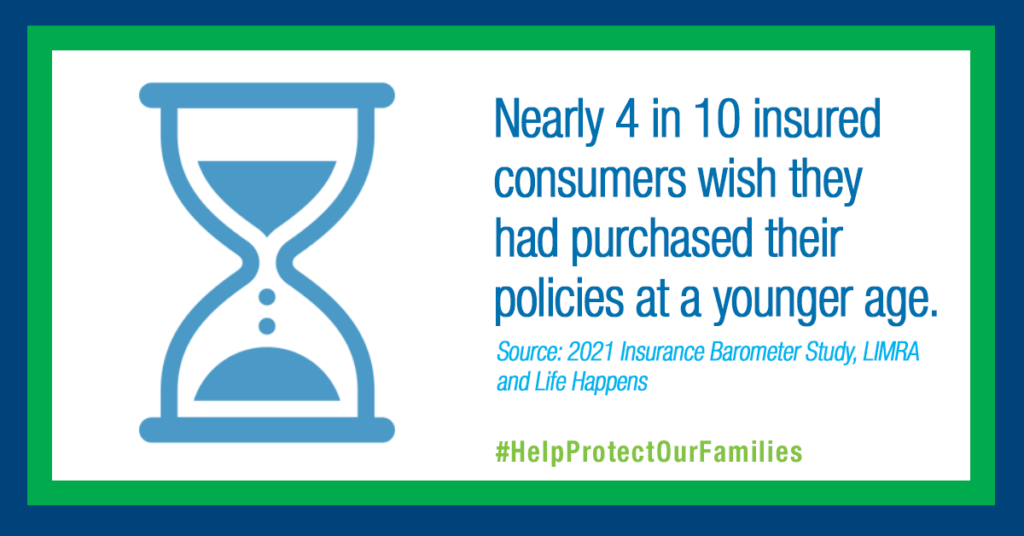
4. I don’t need life insurance until I am older – life insurance is significantly less expensive for the young and healthy. Seniors pay much more for life insurance.
We created our Life Insurance for Dummies (for intelligent people) guide to help people understand the entire process.
Who applies for life insurance in America?
According to the Medical Information Bureau 2021 MIB Life Index Annual Report, application activity by age group was as follows:
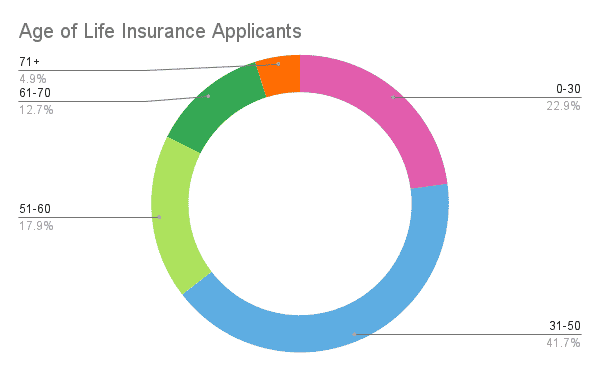
- 0-30 = 22.9% of applicants
- 31-50 = 41.7%
- 51-60 = 17.9% of applicants
- 61-70 = 12.7%
- 71+ = 4.9% of applicants
The MIB is checked for prior application activity when an applicant applies for life insurance.
According to the 2022 MIB midyear report, senior life insurance sales are the fastest growing applicant group (Age 71+).
MIB member companies report information about applicants to the MIB, including high-risk medical conditions, whether they are a smoker or marijuana users.
We looked but couldn’t find details regarding how much life insurance spouses apply for together.
How much life insurance did Americans purchase in 2021?
The American Council of Life Insurers (ACLI) reported that Americans purchased $3.3 trillion of new life insurance coverage in 2020, an increase of 7.9% over 2019.
The average size of new life insurance policies purchased was:
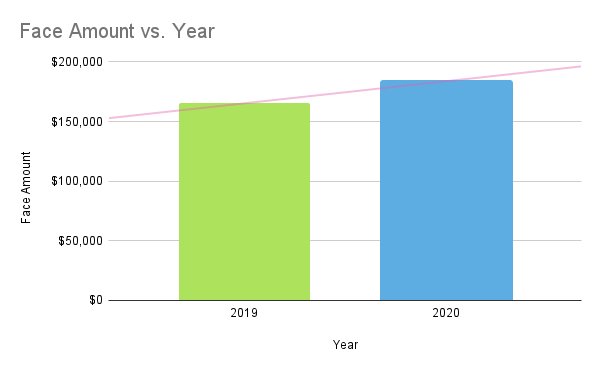
The above chart indicates that most people underestimate their life insurance needs.
Average Life Insurance Payout
What is the average life insurance payout? $183,780.
That’s if we use the logic that Haven Life recently reported. Their assumptions indicated the average amount of life insurance purchased by consumers and used that same number for the average life insurance payout.
We researched this topic to find the average life insurance payout after death, and it’s a hard number to come by.
There’s not one single location that has all this data so we use the same approach as Haven Life does, until a better number can be found.
What types of life insurance policies are people buying?
In addition, the ACLI 2021 Life Insurance Fact Book indicated that:
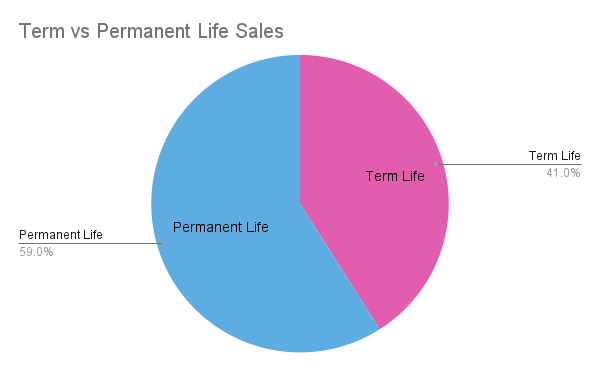
Permanent products would be universal life insurance and whole life.
Milliman, an international actuarial and consulting firm for the insurance industry, completes an annual survey related to term life insurance sales.
According to Milliman, the breakdown of term life insurance sales by term length is as follows:
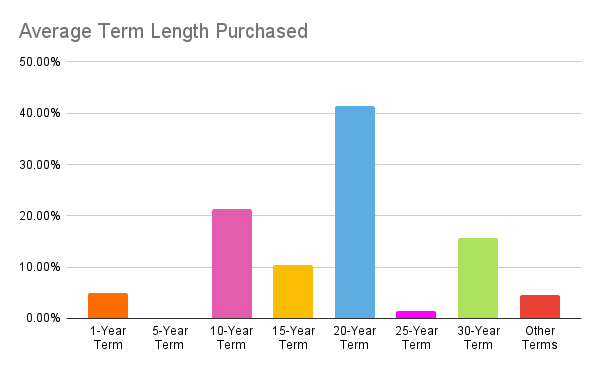
- 1-year term – 4.9% of sales
- 5-year term – 0.1% of sales
- 10-year term – 21.4% of sales
- 15-year term – 10.5% of sales
- 20-year term – 41.4% of sales
- 25-year term – 1.5% of sales
- 30-year term – 15.7% of sales
- Other terms – 4.5% of sales
Newer term lengths such as 35-year and 40-year term life are a small percentage of the market.
Our own sales experience is very similar to the above percentages.
Make sure you buy a policy with a good term life insurance conversion privilege.
How is life insurance distributed?
Several distribution models are used to sell life insurance, including:
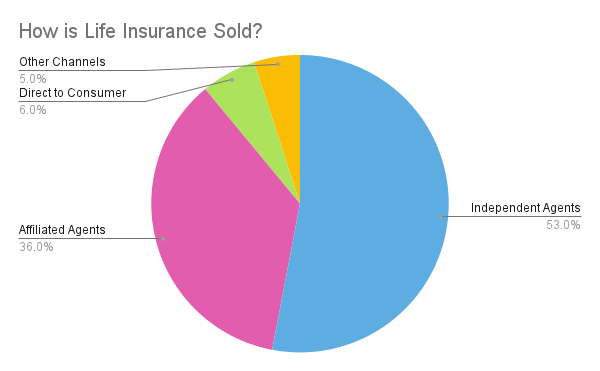
- Independent agents – 53%
- Affiliated agents – 36%
- Direct to consumer – 6%
- Other miscellaneous channels – 5%
Source – U.S. Individual Life Insurance Sales Trends, Industry Estimates, 2019, LIMRA, 2020
Independent agents sell more life insurance than any other group.
Chances are that your business is processed through a NAILBA member if you are an independent agent.
NAILBA is a trade association representing 300+ independent insurance brokerages and 10,000+ brokers and processes $4 billion in life insurance premiums annually.
Affiliated agents are also known as career agents – They represent a company such as Northwestern Mutual or State Farm.
Direct-to-consumer companies handle a small portion of the life insurance business; the rest is typically sold through fraternal organizations like the Fraternal Order of Police.
Other miscellaneous channels would be the AICPA Life Insurance program and Costco life insurance program.
Life Insurance Market Share
The National Association of Insurance Commissioners publishes its annual market share reports detailing the top 125 life insurance companies in terms of direct written premium.
The 30 best life insurance companies account for over 75% of the direct written premium.
The latest reports available are based on 2020. The report covering 2021 is typically released in March.
| Company | Premium | Market Share |
|---|---|---|
| New York Life | $11,598,908,461 | 6.77% |
| Northwestern Mutual | $11,265,168,591 | 6.58% |
| Prudential | $10,000,944,928 | 5.84% |
| Metropolitan | $9,662,130,067 | 5.64% |
| Lincoln National | $8,309,891,047 | 4.85% |
| Mass Mutual | $7,896,230,272 | 4.61% |
| State Farm | $4,968,203,006 | 2.90% |
| AEGON | $4,792,523,909 | 2.80% |
| John Hancock | $4,700,249,960 | 2.74% |
| Minnesota Mutual | $4,683,600,885 | 2.73% |
| Guardian | $4,254,831,416 | 2.48% |
| Pacific Life | $3,975,419,030 | 2.32% |
| AIG | $3,548,776,864 | 2.07% |
| Nationwide | $3,194,905,409 | 1.87% |
| Equitable | $2,854,593,234 | 1.67% |
| Sammons Enterprises | $2,670,570,716 | 1.56% |
| Mutual of Omaha | $2,660,649,482 | 1.55% |
| Primerica | $2,578,185,936 | 1.51% |
| Globe Life | $2,516,043,648 | 1.47% |
| Dai-Ichi Life Holdings | $2,471,750,449 | 1.44% |
| Unum Group | $2,384,152,531 | 1.39% |
| Voya Financial | $2,352,166,611 | 1.37% |
| Principal | $2,291,713,852 | 1.34% |
| Brighthouse | $2,276,932,676 | 1.33% |
| Penn Mutual | $2,212,856,912 | 1.29% |
| Hartford | $2,001,474,236 | 1.17% |
| National Life Group | $1,897,801,392 | 1.11% |
| Zurich | $1,718,771,197 | 1.00% |
| Western-Southern | $1,653,145,649 | 0.97% |
| Thrivent | $1,532,638,203 | 0.89% |
| Banner Life | $1,397,080,994 | 0.82% |
Resources
We compiled this article using life insurance industry resources and 24 years of experience.
Industry Resources Include:
LIMRA – 2021 Insurance Barometer Survey In January 2021, LIMRA and Life Happens engaged an online panel to survey adult consumers who are financial decision-makers in their households. The survey generated over 3,000 responses. The results were weighted to represent the U.S. population.
2020 U.S. Bureau of Labor Statistics – The Bureau of Labor Statistics measures labor market activity, working conditions, price changes, and productivity in the U.S. economy to support public and private decision-making.
Medical Information Bureau 2021 MIB Life Annual Index Report provides insight into individual life insurance application activity.
American Council of Life Insurers (ACLI) 2021 Life Insurers Fact Book – This annual statistical report of the American Council of Life Insurers (ACLI) provides information on trends and statistics about life insurance industry. ACLI represents approximately 280 member companies, representing 93 percent of life insurance premiums in the U.S.
Milliman’s Term Life Insurance Issues 2021 Survey – Milliman is an independent risk management company that provides data-driven expertise to the life insurance industry.
Final Words
Life insurance statistics and facts can be helpful when trying to understand the life insurance industry.
Life insurance statistics and facts can paint a clearer picture of the industry, how it works, how it makes money, and what is essential to know about life insurance.
Moreover, life insurance statistics and facts can help you determine which life insurance option might be best for you and your family.
We hope you find this blog post helpful. If so, we encourage you to share it with your friends, family, and colleagues.
Related Articles

Life Insurance for SBA Loans: A Comprehensive Guide

Paramedical Exams: Your Complete Guide to Life Insurance Success

Is 40-Year Term Life Insurance Worth It? Here’s What You Need to Know

AICPA Life Insurance Review – Should You Choose It Over Individual Plans?

How Does Weight Affect Your Life Insurance Rate?